April Data Review:
The Slow Recovery
April’s data story is all about a slow recovery from the precipitous drop that began around mid-March. With many stay-at-home orders still in full force, April started out in a much similar position to where March ended.
When April ended, however, data was in a much different position, hinting at a steady recovery of a historically resilient industry. Over the course of April, the industry saw slow and steady positive movement across all major key performance indicators.
This is not to say there was growth in April—revenue and transactions were still in negative growth territory overall. New Client Growth (NCG) and Average TransactionCharge (ATC) did show growth over previous years, however.
But not everyone is seeing the light right now. Places like California that have been hit hard (especially those in the Bay Area) are seeing a slower recovery than most states. Fortunately, many clinics have received Paycheck Protection Program monies that can help them through the short-term pain that the COVID-19 crisis is causing.
Revenue is the product of Transactions and Average Transaction Charge (ATC).
As seen by the chart, ATC has continued to stay strong with growth over prior year, while transactional volume is the culprit for lack of revenue growth in April. It’s a similar story to what we saw in the second half of March. Due to the sustained losses posted in April, April ended up worse off overall than March. Down 13% in revenue, while March was only down 3%.
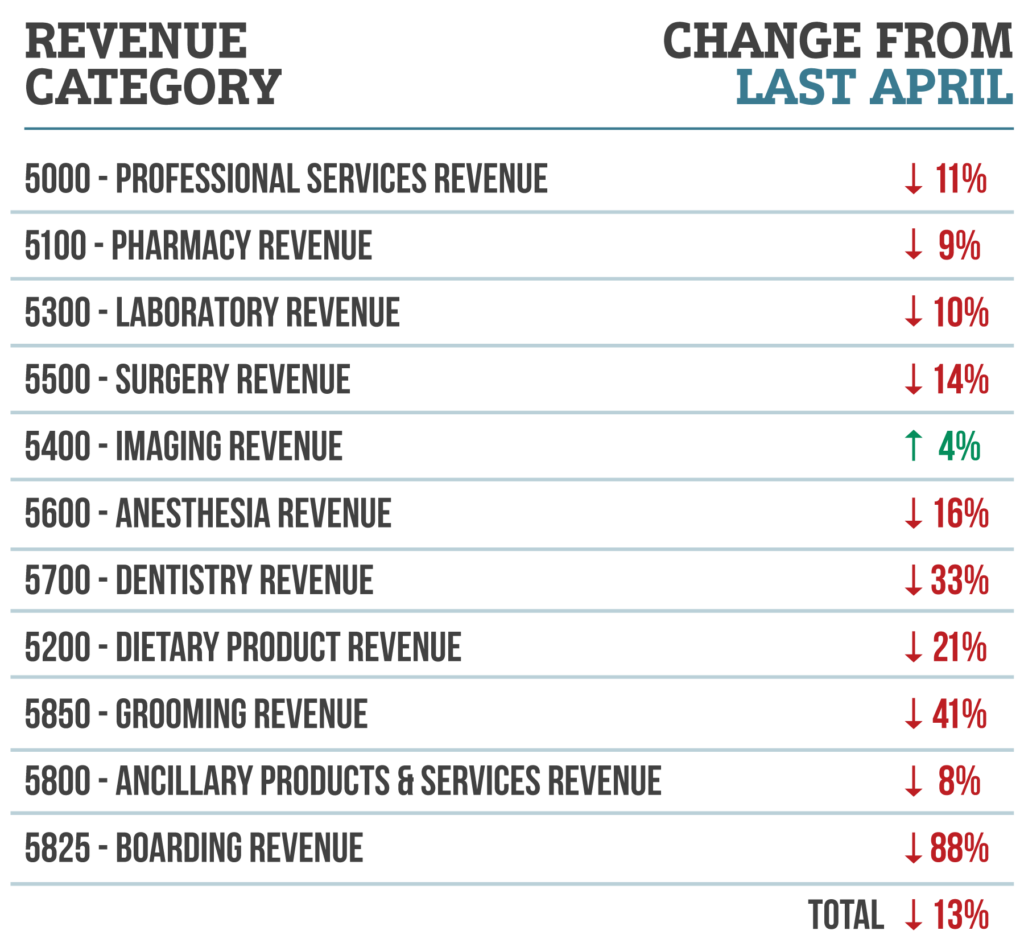
Below is a breakdown of revenue category performance for April 2020 compared to April 2019. There was an across the board slowdown in April with the only growth occurring in imaging. Grooming and boarding continue to show the largest drops.
Dietary products increased in March due to people stocking up for the stay-at-home order, but we did not see the same buying pattern play out in April. The large drops in dentistry and surgery were likely due to the bans on elective procedures in some states.
Transactions can be thought of as volume of visits into the hospital, and that’s obviously where we’ve seen some major negative impacts.
Overall volume through clinics is the metric that has driven poor results for the industry during the COVID-19 crisis. April saw outcomes similar to the second half ofMarch, but over the course of the month there was great improvement. The improvement could be the result of “non-essential” procedures and surgeries now becoming more urgent in nature, or from the population’s change in attitude and compliance regarding stay-at-home protocols.
April saw another similar trend to what was reported for the second half of March, with very low transactions and high ATC on weekends (Sunday in particular)—however this time, the Easter Sunday holiday may have played into a few weekends. Since Easter fell earlier this year than last year (the 20th versus the 12th), that explains the large negative variances on the 12th and the above-par performance on the 20th.
Average Transaction Charge is the average amount spent during a visit.
ATC held strong through April as it did in March, driven by a decrease in wellness visits and an increase in more urgent cases. Augmenting this even further is general practice electing to remove Sundays from the schedule in times of a slowdown. With emergency clinics remaining open, this exacerbates high ATC.
New client growth was the only metric (aside from ATC) that demonstrated positive movement as April came to a close. Seven of the last 15 days in April were up in that metric, further demonstrating signs of recovery.
Be sure to keep up with our daily stats on iVET360’s dedicated COVID-19 site to see how you are faring against the rest of the industry. We also invite you to take advantage of three complimentary months of our Pulse reporting platform so you can more easily and accurately monitor your business and navigate this difficult time.